Urbanization! ...or not?
The Swedish population statistic for 2018 has arrived, a highlight of the year for everyone with an interest in how municipalities and regions are developing populationwise.
Kairos Future definitely belong to this group, since the early 90s we have been interested in how people move within the country and why. We have naturally got to grips with the recent data from Statistics Sweden (SCB), and have put together a quick analysis of how people moved between 2010 to 2018, the progress within various groups of municipalities, as well as what it means for the local councils’ prosperity going forward.
The urbanization continues…
Looking at the municipalities that neither are a bigger city nor are close to any of them the development is stable. More people in Sweden more from these municipalities than to them: domestic net movement in relation to the size of the population is still negative (see Figure 1 below).
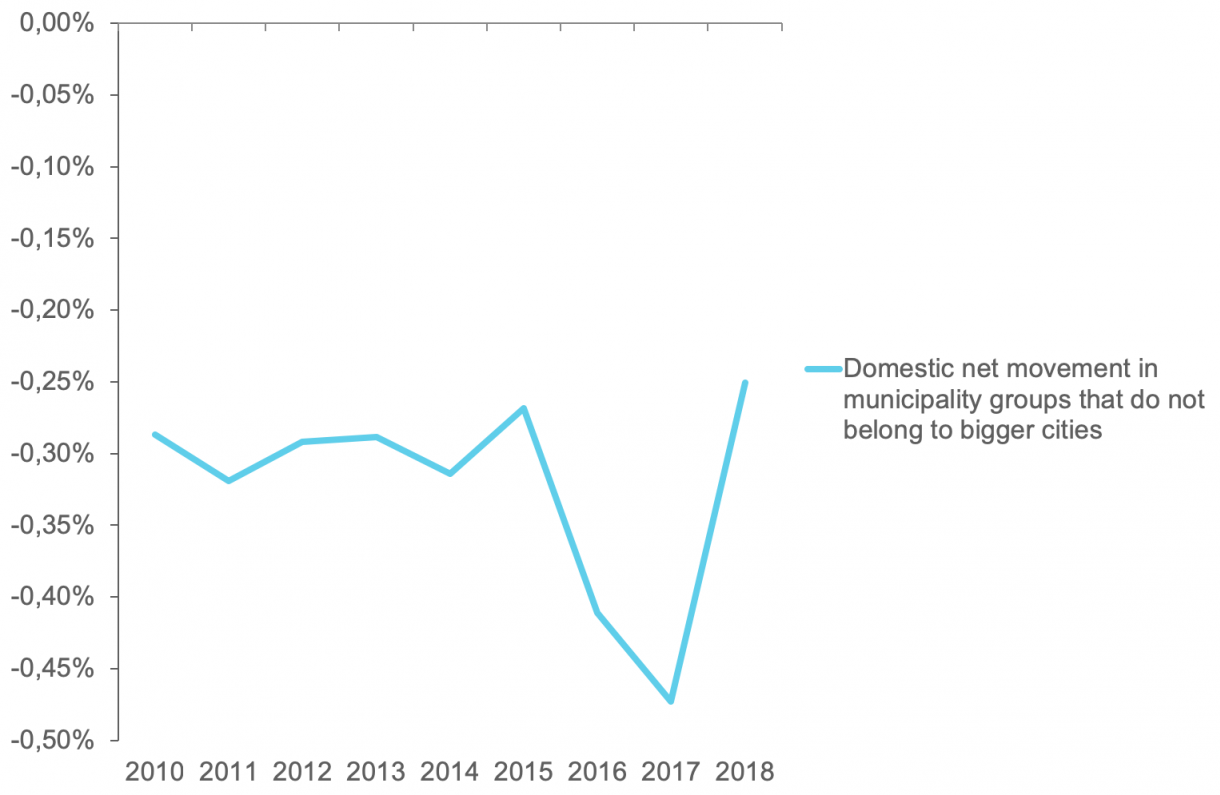
Figure 1. Domestic percentage net movement in municipality groups that do not belong to bigger cities. Many rural areas and smaller towns with significant distance to bigger cities, or cities like Västerås, Örebro, Helsingborg, and Umeå, belong to this group.
…or not?
If we look a Sweden's biggest cities, Stockholm, Gothenburgh, and Malmö, can we expect the opposite pattern? Most of Swedes have heard stories about haulage the size of buses arriving daily in Stockholm, the city that is growing exponentially.
Examining the numbers, particularly from recent years, we can see that domestic movement is actually leading to the bigger cities losing people. This has been the case in Stockholm’s municipality, as well as Gothenburg’s and Malmö’s municipalities in the past few years (see Figure 2 below).
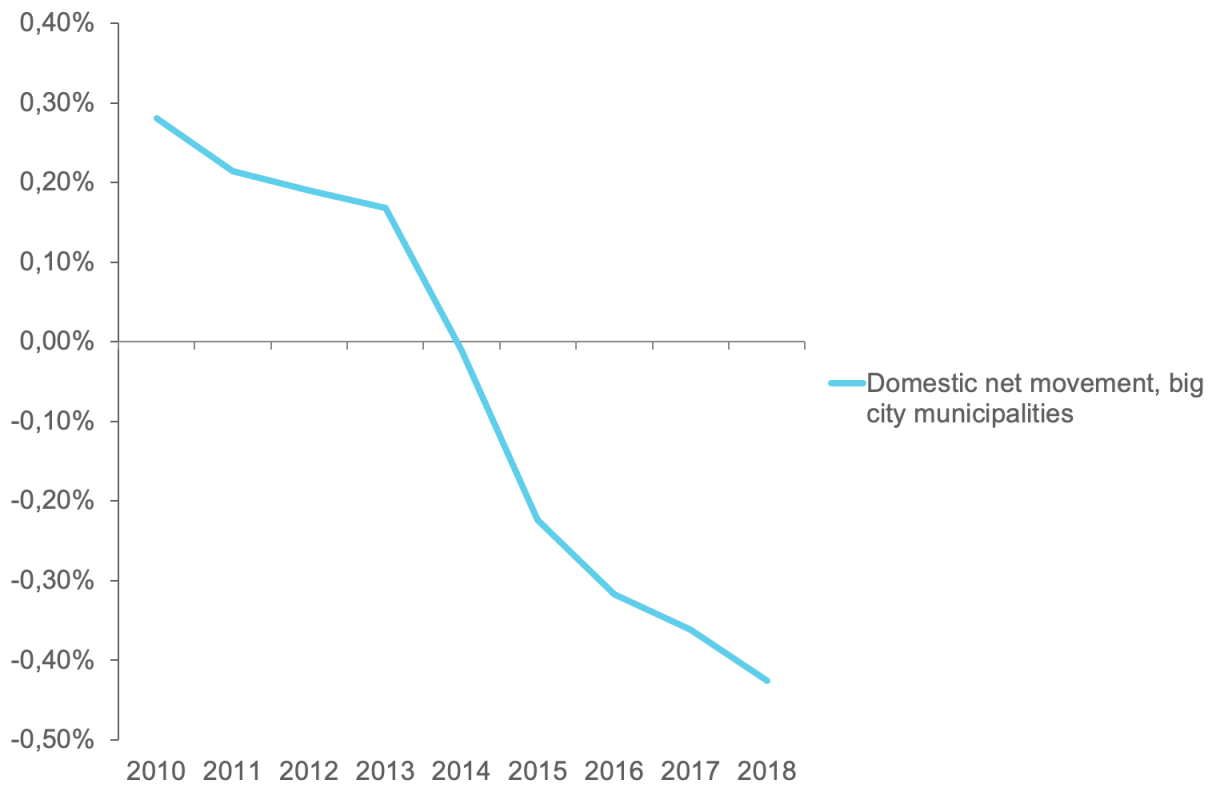
Figure 2. Domestic net movement in percentage in big city municipalities (Stockholm, Gothenburg, Malmö).
The moving van that moved on
How can we make sense of this? In truth, a lot of people are still moving to bigger cities, Stockholm by itself saw an increase of 54 324 people in 2018. Over 365 days it actually corresponds pretty close to a busload of people, mainy consisting of 20-ish year olds.
What this story is not revealing is that when the 20-ish year olds get off in Stockholm, the bus is boarded by another larger group of people and continue on. This time it is mainly 30-ish year olds together with 0-9 year olds. So where is that bus heading?
Last stop Upplands-Bro, Lomma, Kungälv
Looking at who is really the “winner” – the place where most people move in relation to the size of the municipality – we find the terminal station for the bus that left the city centre: suburbs and municipalities surrounding the bigger cities. This group of municipalities has by far the biggest domestic net movement in relation to their own population.
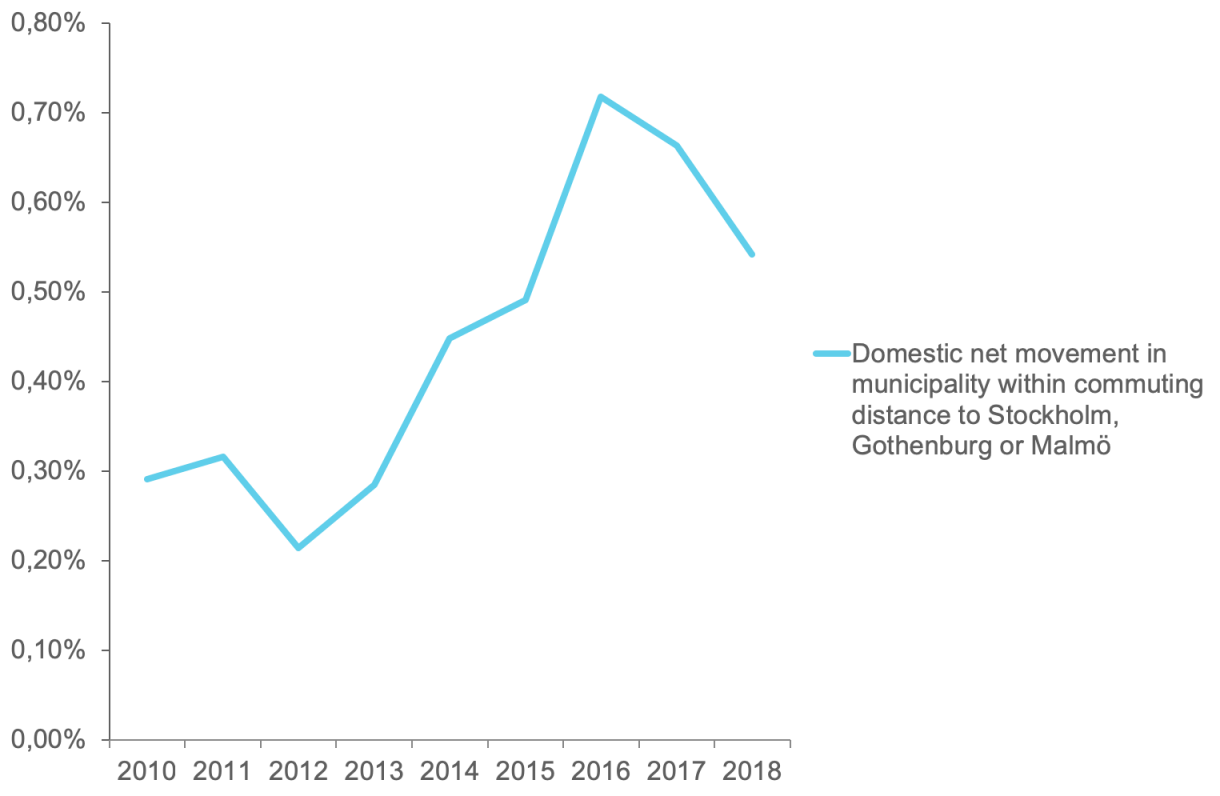
Figure 3. Domestic percentage of net movement in municipality group that is within commuting distance of Stockholm, Gothenburg or Malmö.
Urbanization with significant reservation
There are a lot of nice things to say about Upplands-Bro, Lomma and Kungälv, but they are not all that urban. Still, this is where the biggest proportion of people move. As a result, when describing the urbanization in Sweden we have to consider the significant net flow from the big cities to the surrounding municipalities in recent years.
This is not to say that the big cities are not growing. Because they do, a lot. However, the growth is a result of immigration to the big cities outweighing the emigration and that more people are being born than pass away.
Connected municipalities close to cities gain more people
This far we’ve mainly looked at what is happening in the regions around the big cities, though the perhaps most interesting movement can be found in the less talked about group municipalities within commuting distance to bigger city. In this group we have municipalities such as Hammarö outside of Karlstad, Habo outside of Jönköping, and Sjöbo outside of Lund. Even the municipality with the highest domestic net movement in 2018, Trosa, is in this group.
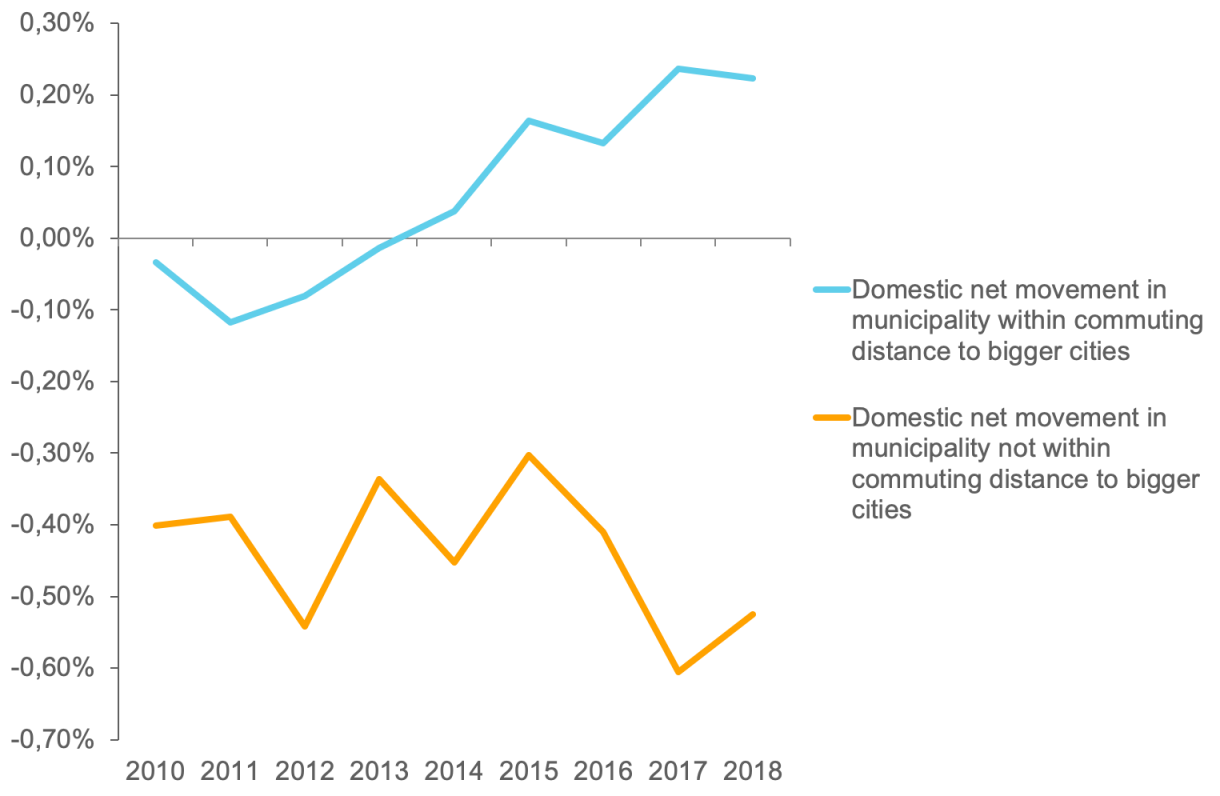
Figure 4. Domestic percentage of net movement in the municipality group with connections for commuting to bigger cities.
In the last couple of years, the domestic net movement in this group has grown in a positive direction: where the municipalities surrounding the regional engine are the winners. The group of municipalities with commuter connections to bigger cities is large, and the numbers look different across the municipalities, though the overarching pattern is clear. As the figure above demonstrate, the municipalities with the best connections to the bigger city (the bigger city the better) are the ones that have a positive net movement and growing. Municipalities with fewer connections still have a negative domestic net movement.
Strategic implications for municipalities beyond the main roads
Municipalities without connections to any bigger city, and with an absence of a strong tourism industry will not in the close foreseeable future be able to grow through a domestic net positive movement.
The future is not decided within the municipality’s borders
A large segment of municipalities across the country still have opportunities for growth as an alternative to living in the bigger cities and their growing labour market regions. The downside is that each municipality does not hold the entire solution by themselves, as infrastructure is of the utmost importance. Instead the basic conditions are decided on a regional or even national level. That is why for most municipalities it is wise to put less focus on various local rankings and more focus on how well their municipality is connected.
Do you want a special analysis on how your municipality is faring in the dynamic of movement and why? Contact Fredrik Torberger for more information.